🗓️ Week 03
Wrangling and Tidying Data
18 Oct 2024
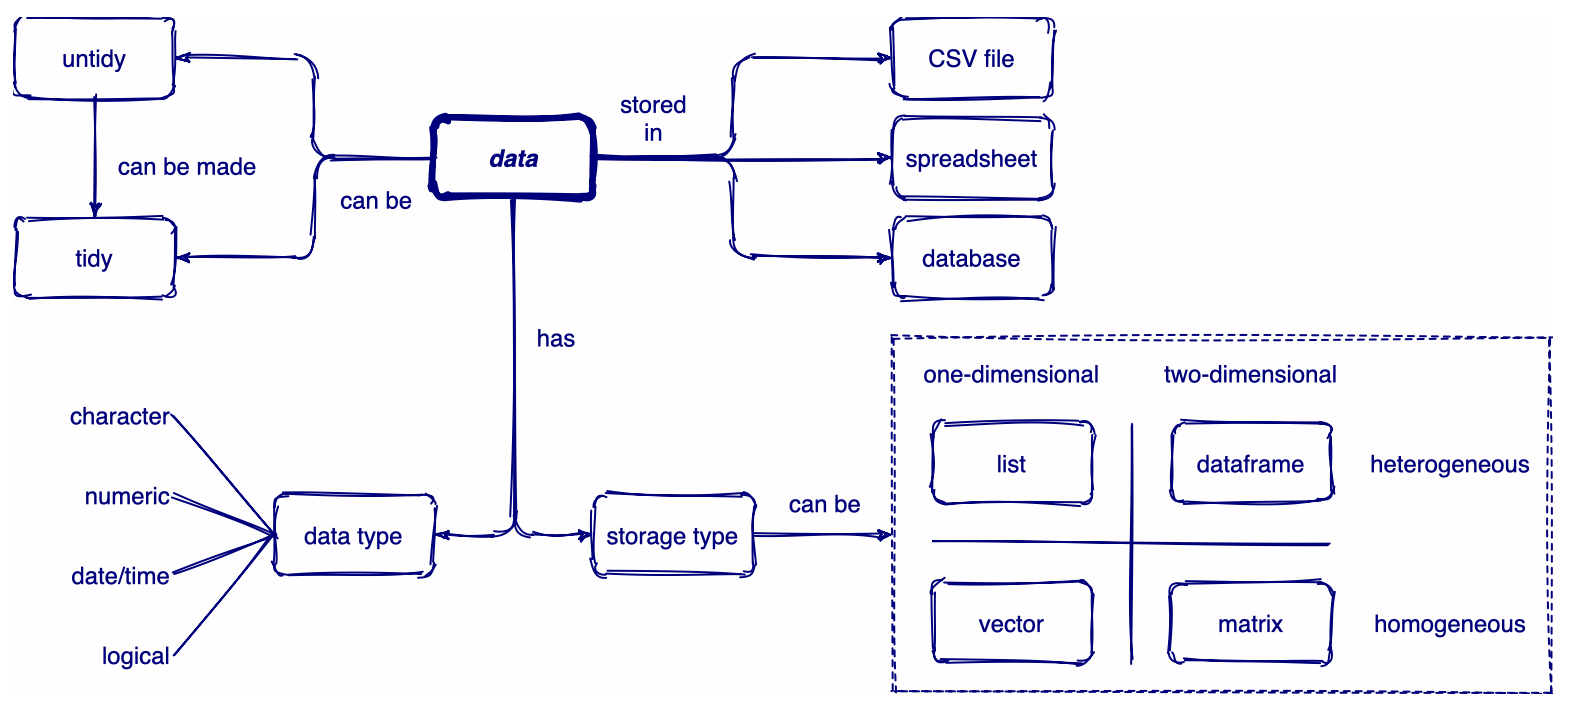
Tidying data
Tidy data
“In the space between chaos and shape, there was another chance.” (C.S. Lewis)
- What makes data tidy:
- Each variable should form a column
- Each observation should form a row
- Each value is a cell; each cell is a single value

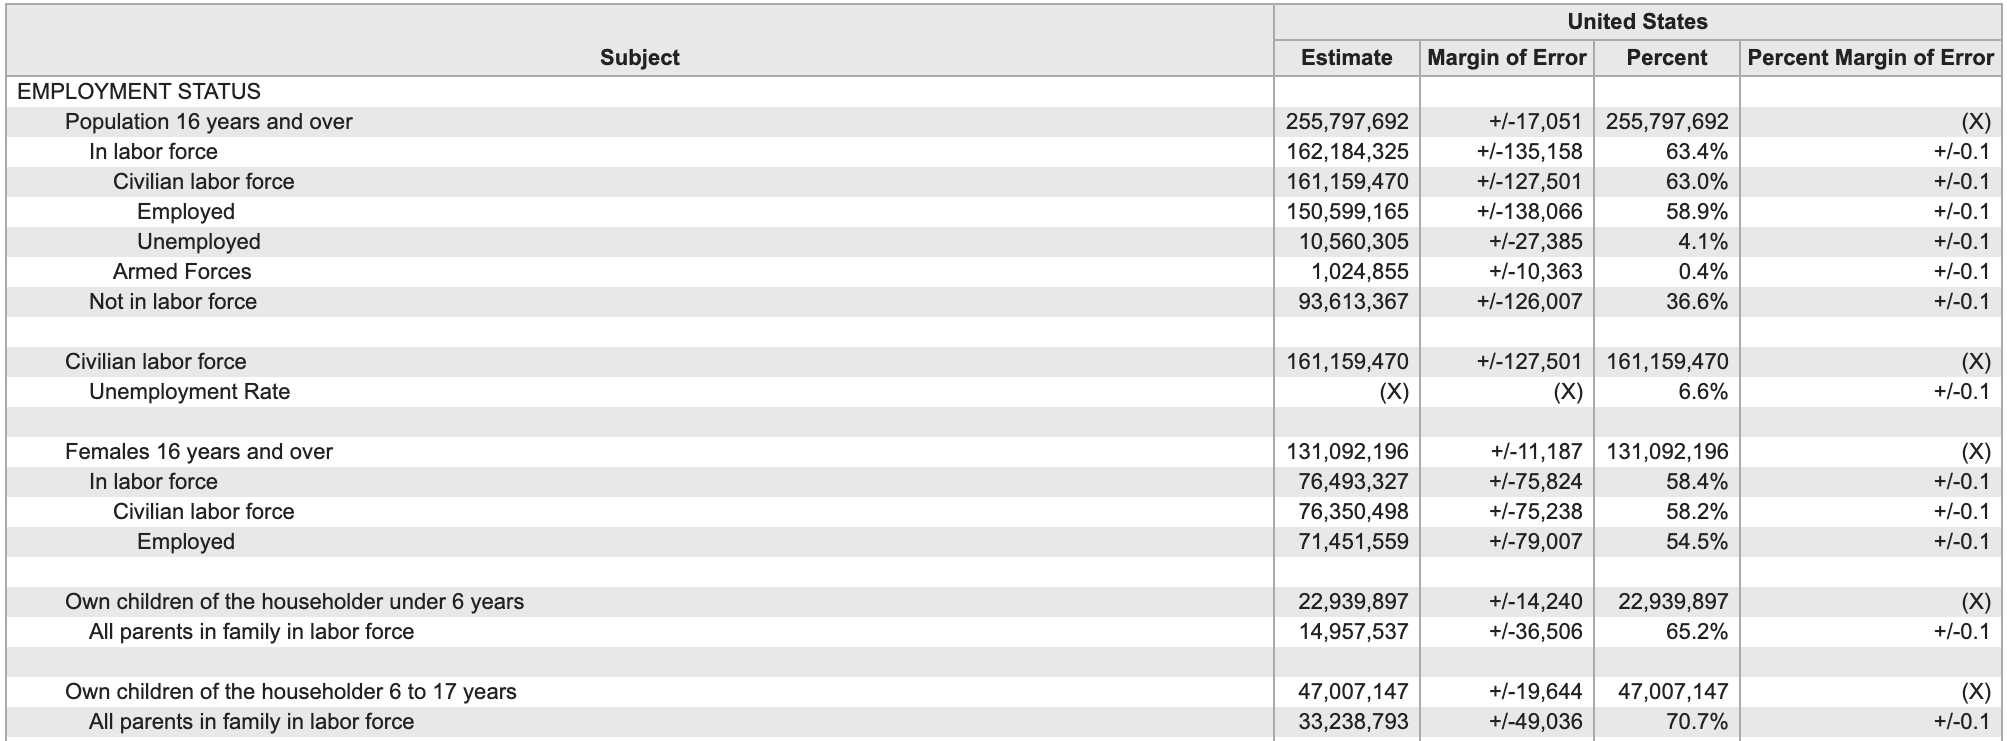
Untidy data
Rules for storing tidy data
- Be consistent
- Choose good names for things
- Write dates as YYYY-MM-DD
- No empty cells
- Put just one thing in a cell
- Don’t use font color or highlighting as data
Why your data should be tidy
Opting for a consistent method of data storage offers a broad benefit. When you maintain a uniform data structure, it simplifies the process of mastering tools that interact with it, as they possess a foundational consistency
A distinct advantage of arranging variables in columns is that it leverages R’s vectorized capabilities. As you discovered in the R workshop, the majority of built-in R functions are designed to operate on vectors of values, which enhances the seamless transformation of tidy data
Overview of data
Collection of R packages for tidy data
If dataframes are tidy, it’s easy to transform, visualise, model, and program them using tidyverse packages

Loading required packages
Displaying and summarising data I
There are so many different ways of looking at data in R
tibble [6 × 4] (S3: tbl_df/tbl/data.frame)
 $ country   : chr [1:6] "Afghanistan" "Afghanistan" "Brazil" "Brazil" ...
 $ year      : num [1:6] 1999 2000 1999 2000 1999 ...
 $ cases     : num [1:6] 745 2666 37737 80488 212258 ...
$ population: num [1:6] 2.00e+07 2.06e+07 1.72e+08 1.75e+08 1.27e+09 ...Rows: 6
Columns: 4
$ country <chr> "Afghanistan", "Afghanistan", "Brazil", "Brazil", "China", …
$ year <dbl> 1999, 2000, 1999, 2000, 1999, 2000
$ cases <dbl> 745, 2666, 37737, 80488, 212258, 213766
$ population <dbl> 19987071, 20595360, 172006362, 174504898, 1272915272, 12804…Displaying and summarising data II
# A tibble: 87 × 3
   name               height  mass
   <chr>               <int> <dbl>
 1 Luke Skywalker        172    77
 2 C-3PO                 167    75
 3 R2-D2                  96    32
 4 Darth Vader           202   136
 5 Leia Organa           150    49
 6 Owen Lars             178   120
 7 Beru Whitesun lars    165    75
 8 R5-D4                  97    32
 9 Biggs Darklighter     183    84
10 Obi-Wan Kenobi        182    77
# ℹ 77 more rows# A tibble: 3 × 2
gender avg_height
<chr> <dbl>
1 feminine 165.
2 masculine 177.
3 <NA> 181.Reshaping
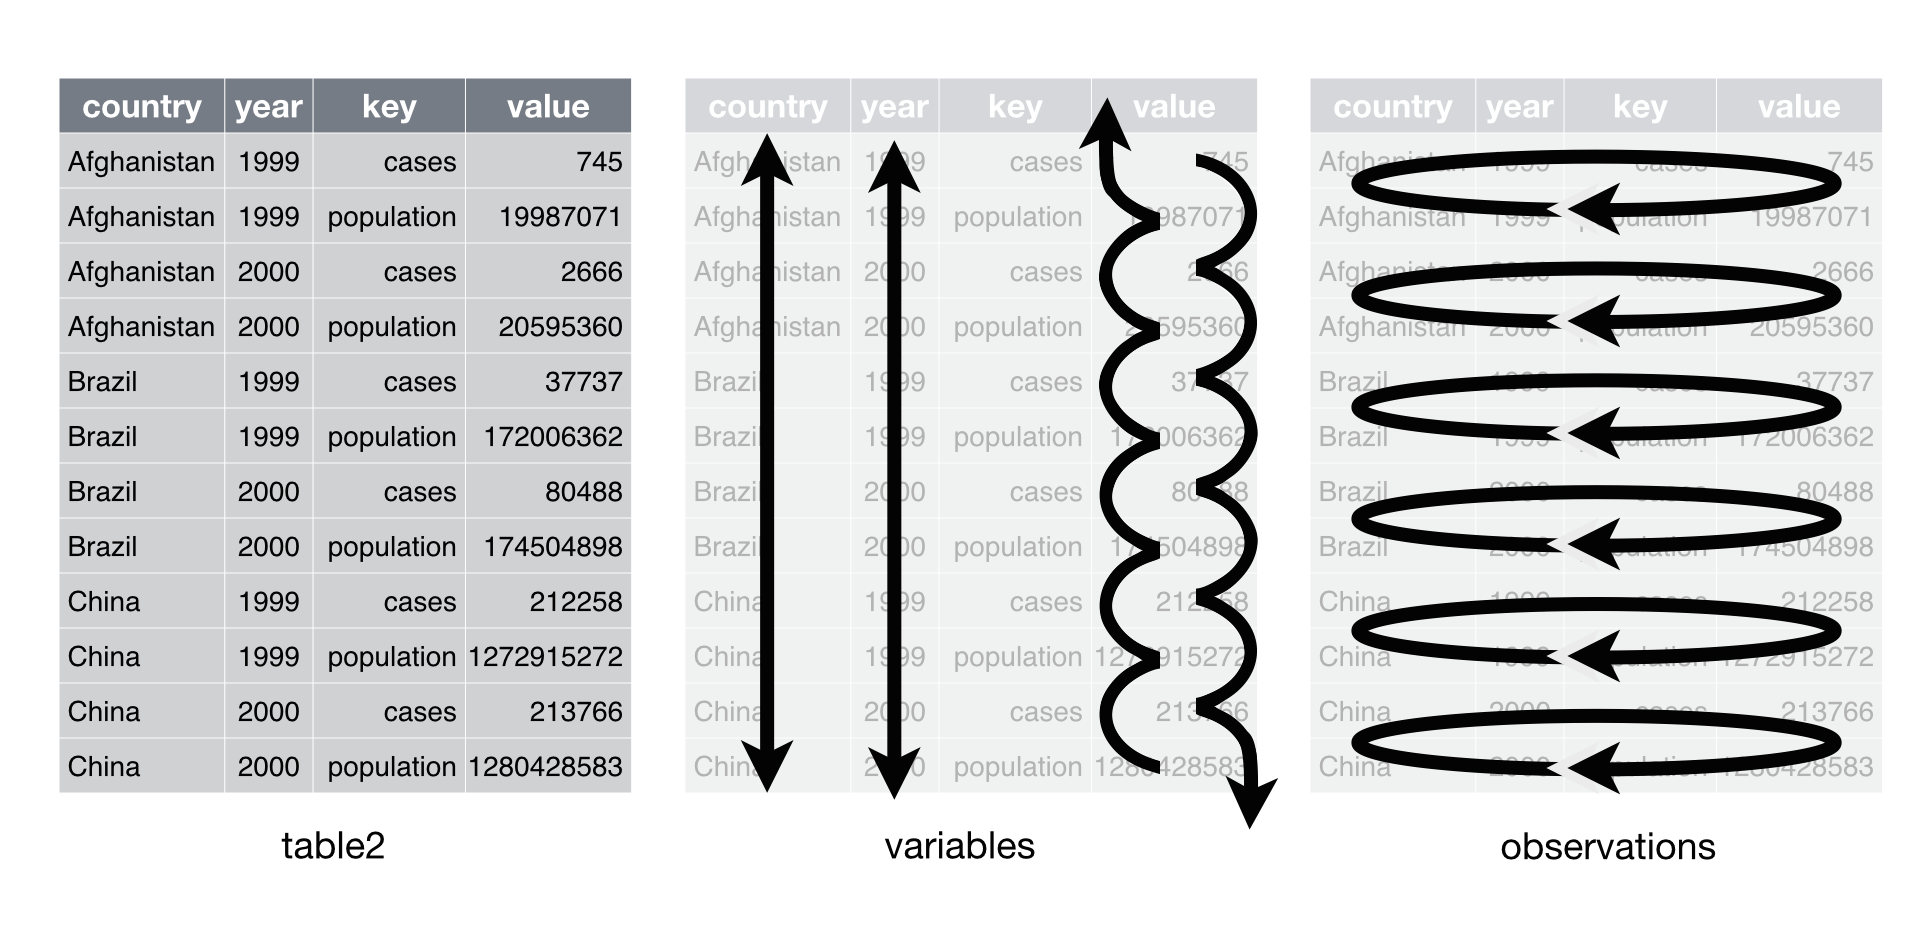
Pivoting
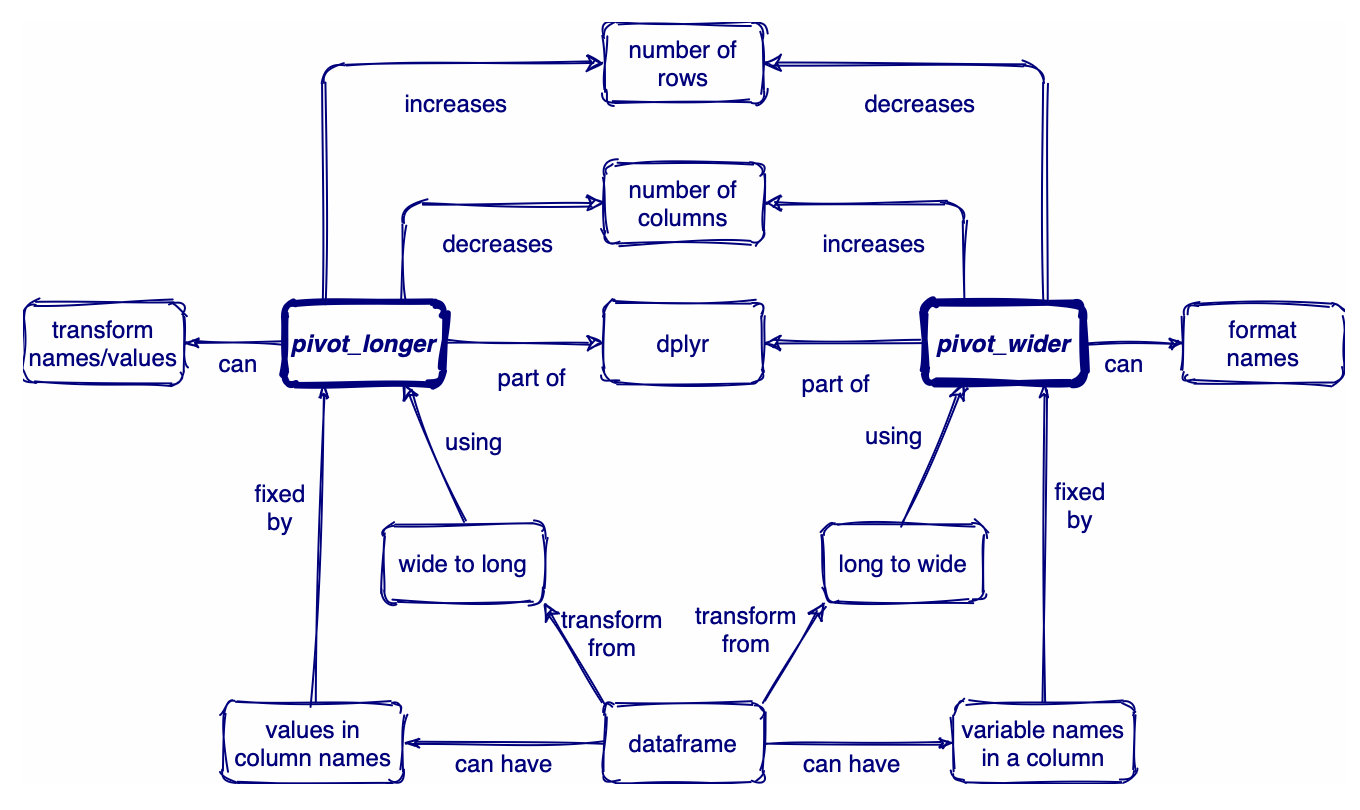
Pivot long
pivot_longer()increases the number of rows (longer) and decreases the number of columns. The inverse function ispivot_wider()The names of the ID### columns rotate into an index row (number), and the measure values shift over to the corresponding number and group
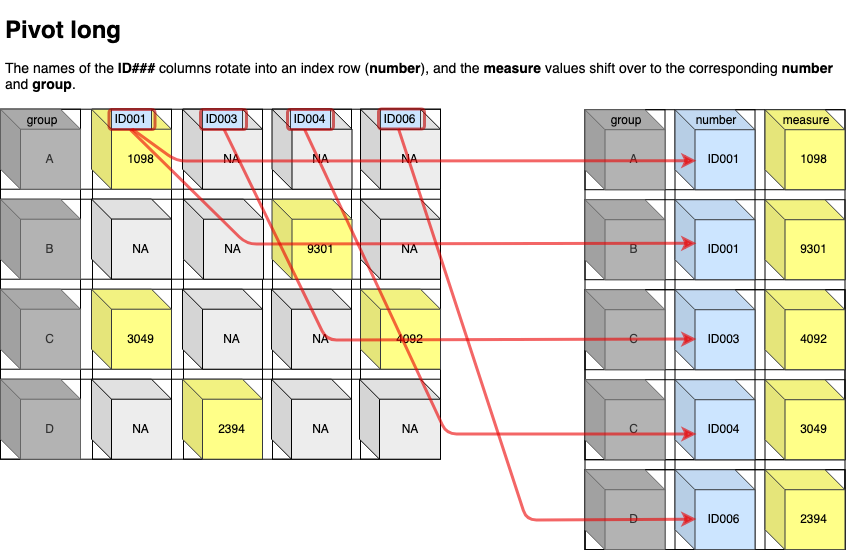
Pivot longer
# A tibble: 3 × 3
  country     `1999` `2000`
  <chr>        <dbl>  <dbl>
1 Afghanistan    745   2666
2 Brazil       37737  80488
3 China       212258 213766
table4a %>%
pivot_longer(
cols = c("1999", "2000"), # Selected columns
names_to = "year", # Shorter columns (the columns going to be in one column called year)
values_to = "cases"
) # Longer rows (the values are going to be in a separate column called named cases)# A tibble: 6 × 3
country year cases
<chr> <chr> <dbl>
1 Afghanistan 1999 745
2 Afghanistan 2000 2666
3 Brazil 1999 37737
4 Brazil 2000 80488
5 China 1999 212258
6 China 2000 213766Pivot longer (another example)
# A tibble: 317 × 79
   artist     track date.entered   wk1   wk2   wk3   wk4   wk5   wk6   wk7   wk8
   <chr>      <chr> <date>       <dbl> <dbl> <dbl> <dbl> <dbl> <dbl> <dbl> <dbl>
 1 2 Pac      Baby… 2000-02-26      87    82    72    77    87    94    99    NA
 2 2Ge+her    The … 2000-09-02      91    87    92    NA    NA    NA    NA    NA
 3 3 Doors D… Kryp… 2000-04-08      81    70    68    67    66    57    54    53
 4 3 Doors D… Loser 2000-10-21      76    76    72    69    67    65    55    59
 5 504 Boyz   Wobb… 2000-04-15      57    34    25    17    17    31    36    49
 6 98^0       Give… 2000-08-19      51    39    34    26    26    19     2     2
 7 A*Teens    Danc… 2000-07-08      97    97    96    95   100    NA    NA    NA
 8 Aaliyah    I Do… 2000-01-29      84    62    51    41    38    35    35    38
 9 Aaliyah    Try … 2000-03-18      59    53    38    28    21    18    16    14
10 Adams, Yo… Open… 2000-08-26      76    76    74    69    68    67    61    58
# ℹ 307 more rows
# ℹ 68 more variables: wk9 <dbl>, wk10 <dbl>, wk11 <dbl>, wk12 <dbl>,
#   wk13 <dbl>, wk14 <dbl>, wk15 <dbl>, wk16 <dbl>, wk17 <dbl>, wk18 <dbl>,
#   wk19 <dbl>, wk20 <dbl>, wk21 <dbl>, wk22 <dbl>, wk23 <dbl>, wk24 <dbl>,
#   wk25 <dbl>, wk26 <dbl>, wk27 <dbl>, wk28 <dbl>, wk29 <dbl>, wk30 <dbl>,
#   wk31 <dbl>, wk32 <dbl>, wk33 <dbl>, wk34 <dbl>, wk35 <dbl>, wk36 <dbl>,
#   wk37 <dbl>, wk38 <dbl>, wk39 <dbl>, wk40 <dbl>, wk41 <dbl>, wk42 <dbl>, …
Use pivot longer
billboard %>%
  pivot_longer(
    cols = starts_with("wk"), # Use regular expressions
    names_to = "week",
    values_to = "rank",
    values_drop_na = TRUE # Drop NAs
  )
# A tibble: 5,307 × 5
artist track date.entered week rank
<chr> <chr> <date> <chr> <dbl>
1 2 Pac Baby Don't Cry (Keep... 2000-02-26 wk1 87
2 2 Pac Baby Don't Cry (Keep... 2000-02-26 wk2 82
3 2 Pac Baby Don't Cry (Keep... 2000-02-26 wk3 72
4 2 Pac Baby Don't Cry (Keep... 2000-02-26 wk4 77
5 2 Pac Baby Don't Cry (Keep... 2000-02-26 wk5 87
6 2 Pac Baby Don't Cry (Keep... 2000-02-26 wk6 94
7 2 Pac Baby Don't Cry (Keep... 2000-02-26 wk7 99
8 2Ge+her The Hardest Part Of ... 2000-09-02 wk1 91
9 2Ge+her The Hardest Part Of ... 2000-09-02 wk2 87
10 2Ge+her The Hardest Part Of ... 2000-09-02 wk3 92
# ℹ 5,297 more rowsPivot wide
Now the values in number become the new column names, and the measure values get inserted into the intersection of ID### columns and group
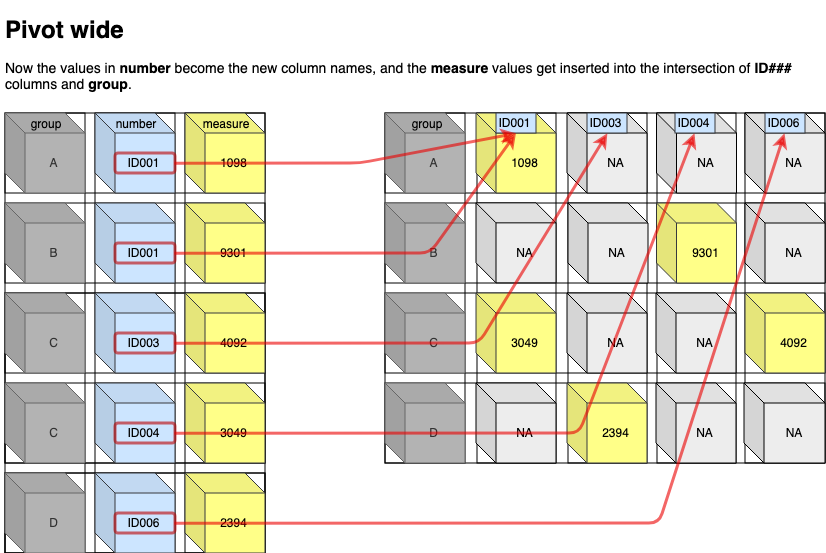
Use pivot wider
# A tibble: 12 × 4
   country      year type            count
   <chr>       <dbl> <chr>           <dbl>
 1 Afghanistan  1999 cases             745
 2 Afghanistan  1999 population   19987071
 3 Afghanistan  2000 cases            2666
 4 Afghanistan  2000 population   20595360
 5 Brazil       1999 cases           37737
 6 Brazil       1999 population  172006362
 7 Brazil       2000 cases           80488
 8 Brazil       2000 population  174504898
 9 China        1999 cases          212258
10 China        1999 population 1272915272
11 China        2000 cases          213766
12 China 2000 population 1280428583# A tibble: 6 × 4
country year cases population
<chr> <dbl> <dbl> <dbl>
1 Afghanistan 1999 745 19987071
2 Afghanistan 2000 2666 20595360
3 Brazil 1999 37737 172006362
4 Brazil 2000 80488 174504898
5 China 1999 212258 1272915272
6 China 2000 213766 1280428583Further challenges (separating)
# A tibble: 6 × 3
  country      year rate
  <chr>       <dbl> <chr>
1 Afghanistan  1999 745/19987071
2 Afghanistan  2000 2666/20595360
3 Brazil       1999 37737/172006362
4 Brazil       2000 80488/174504898
5 China        1999 212258/1272915272
6 China        2000 213766/1280428583
You can specify how to separate joined values
# A tibble: 6 × 4
  country      year cases  population
  <chr>       <dbl> <chr>  <chr>
1 Afghanistan  1999 745    19987071
2 Afghanistan  2000 2666   20595360
3 Brazil       1999 37737  172006362
4 Brazil       2000 80488  174504898
5 China        1999 212258 1272915272
6 China        2000 213766 1280428583
Data wrangling
Grammar of data wrangling
There is a package specifically designed for helping you wrangle your data. This package is called dplyr and will allow you to easily accomplish many of the data wrangling tasks necessary
%>%- pipe operator for chaining a sequence of operations- glimpse() - get an overview of what’s included in dataset
- filter() - filter rows
- select() - select, rename, and reorder columns
- rename() - rename columns
- arrange() - reorder rows
- mutate() - create a new column
- group_by() - group variables
- summarize() - summarize information within a dataset
- left_join() - combine data across data frame
Rearranging data
Rows: 32
Columns: 11
$ mpg  <dbl> 21.0, 21.0, 22.8, 21.4, 18.7, 18.1, 14.3, 24.4, 22.8, 19.2, 17.8,…
$ cyl  <dbl> 6, 6, 4, 6, 8, 6, 8, 4, 4, 6, 6, 8, 8, 8, 8, 8, 8, 4, 4, 4, 4, 8,…
$ disp <dbl> 160.0, 160.0, 108.0, 258.0, 360.0, 225.0, 360.0, 146.7, 140.8, 16…
$ hp   <dbl> 110, 110, 93, 110, 175, 105, 245, 62, 95, 123, 123, 180, 180, 180…
$ drat <dbl> 3.90, 3.90, 3.85, 3.08, 3.15, 2.76, 3.21, 3.69, 3.92, 3.92, 3.92,…
$ wt   <dbl> 2.620, 2.875, 2.320, 3.215, 3.440, 3.460, 3.570, 3.190, 3.150, 3.…
$ qsec <dbl> 16.46, 17.02, 18.61, 19.44, 17.02, 20.22, 15.84, 20.00, 22.90, 18…
$ vs   <dbl> 0, 0, 1, 1, 0, 1, 0, 1, 1, 1, 1, 0, 0, 0, 0, 0, 0, 1, 1, 1, 1, 0,…
$ am   <dbl> 1, 1, 1, 0, 0, 0, 0, 0, 0, 0, 0, 0, 0, 0, 0, 0, 0, 1, 1, 1, 0, 0,…
$ gear <dbl> 4, 4, 4, 3, 3, 3, 3, 4, 4, 4, 4, 3, 3, 3, 3, 3, 3, 4, 4, 4, 3, 3,…
$ carb <dbl> 4, 4, 1, 1, 2, 1, 4, 2, 2, 4, 4, 3, 3, 3, 4, 4, 4, 1, 2, 1, 1, 2,…Rearranging data
                     mpg cyl  disp  hp drat    wt  qsec vs am gear carb
Cadillac Fleetwood  10.4   8 472.0 205 2.93 5.250 17.98  0  0    3    4
Lincoln Continental 10.4   8 460.0 215 3.00 5.424 17.82  0  0    3    4
Camaro Z28          13.3   8 350.0 245 3.73 3.840 15.41  0  0    3    4
Duster 360          14.3   8 360.0 245 3.21 3.570 15.84  0  0    3    4
Chrysler Imperial   14.7   8 440.0 230 3.23 5.345 17.42  0  0    3    4
Maserati Bora       15.0   8 301.0 335 3.54 3.570 14.60  0  1    5    8
Merc 450SLC         15.2   8 275.8 180 3.07 3.780 18.00  0  0    3    3
AMC Javelin         15.2   8 304.0 150 3.15 3.435 17.30  0  0    3    2
Dodge Challenger    15.5   8 318.0 150 2.76 3.520 16.87  0  0    3    2
Ford Pantera L      15.8   8 351.0 264 4.22 3.170 14.50  0  1    5    4
Merc 450SE          16.4   8 275.8 180 3.07 4.070 17.40  0  0    3    3
Merc 450SL          17.3   8 275.8 180 3.07 3.730 17.60  0  0    3    3
Merc 280C           17.8   6 167.6 123 3.92 3.440 18.90  1  0    4    4
Valiant             18.1   6 225.0 105 2.76 3.460 20.22  1  0    3    1
Hornet Sportabout   18.7   8 360.0 175 3.15 3.440 17.02  0  0    3    2
Merc 280            19.2   6 167.6 123 3.92 3.440 18.30  1  0    4    4
Pontiac Firebird    19.2   8 400.0 175 3.08 3.845 17.05  0  0    3    2
Ferrari Dino        19.7   6 145.0 175 3.62 2.770 15.50  0  1    5    6
Mazda RX4           21.0   6 160.0 110 3.90 2.620 16.46  0  1    4    4
Mazda RX4 Wag       21.0   6 160.0 110 3.90 2.875 17.02  0  1    4    4
Hornet 4 Drive      21.4   6 258.0 110 3.08 3.215 19.44  1  0    3    1
Volvo 142E          21.4   4 121.0 109 4.11 2.780 18.60  1  1    4    2
Toyota Corona       21.5   4 120.1  97 3.70 2.465 20.01  1  0    3    1
Datsun 710          22.8   4 108.0  93 3.85 2.320 18.61  1  1    4    1
Merc 230            22.8   4 140.8  95 3.92 3.150 22.90  1  0    4    2
Merc 240D           24.4   4 146.7  62 3.69 3.190 20.00  1  0    4    2
Porsche 914-2       26.0   4 120.3  91 4.43 2.140 16.70  0  1    5    2
Fiat X1-9           27.3   4  79.0  66 4.08 1.935 18.90  1  1    4    1
Honda Civic         30.4   4  75.7  52 4.93 1.615 18.52  1  1    4    2
Lotus Europa        30.4   4  95.1 113 3.77 1.513 16.90  1  1    5    2
Fiat 128            32.4   4  78.7  66 4.08 2.200 19.47  1  1    4    1
Toyota Corolla 33.9 4 71.1 65 4.22 1.835 19.90 1 1 4 1Renaming columns
Renaming columns
Rows: 32
Columns: 11
$ milepergalon <dbl> 21.0, 21.0, 22.8, 21.4, 18.7, 18.1, 14.3, 24.4, 22.8, 19.…
$ cyl          <dbl> 6, 6, 4, 6, 8, 6, 8, 4, 4, 6, 6, 8, 8, 8, 8, 8, 8, 4, 4, …
$ disp         <dbl> 160.0, 160.0, 108.0, 258.0, 360.0, 225.0, 360.0, 146.7, 1…
$ hp           <dbl> 110, 110, 93, 110, 175, 105, 245, 62, 95, 123, 123, 180, …
$ drat         <dbl> 3.90, 3.90, 3.85, 3.08, 3.15, 2.76, 3.21, 3.69, 3.92, 3.9…
$ wt           <dbl> 2.620, 2.875, 2.320, 3.215, 3.440, 3.460, 3.570, 3.190, 3…
$ qsec         <dbl> 16.46, 17.02, 18.61, 19.44, 17.02, 20.22, 15.84, 20.00, 2…
$ vs           <dbl> 0, 0, 1, 1, 0, 1, 0, 1, 1, 1, 1, 0, 0, 0, 0, 0, 0, 1, 1, …
$ am           <dbl> 1, 1, 1, 0, 0, 0, 0, 0, 0, 0, 0, 0, 0, 0, 0, 0, 0, 1, 1, …
$ gear         <dbl> 4, 4, 4, 3, 3, 3, 3, 4, 4, 4, 4, 3, 3, 3, 3, 3, 3, 4, 4, …
$ carb         <dbl> 4, 4, 1, 1, 2, 1, 4, 2, 2, 4, 4, 3, 3, 3, 4, 4, 4, 1, 2, …
Subsetting observations (row)
Adding single condition:
# A tibble: 16 × 14
   name     height  mass hair_color skin_color eye_color birth_year sex   gender
   <chr>     <int> <dbl> <chr>      <chr>      <chr>          <dbl> <chr> <chr>
 1 Taun We     213  NA   none       grey       black             NA fema… femin…
 2 Adi Gal…    184  50   none       dark       blue              NA fema… femin…
 3 Ayla Se…    178  55   none       blue       hazel             48 fema… femin…
 4 Shaak Ti    178  57   none       red, blue… black             NA fema… femin…
 5 Luminar…    170  56.2 black      yellow     blue              58 fema… femin…
 6 Zam Wes…    168  55   blonde     fair, gre… yellow            NA fema… femin…
 7 Jocasta…    167  NA   white      fair       blue              NA fema… femin…
 8 Barriss…    166  50   black      yellow     blue              40 fema… femin…
 9 Beru Wh…    165  75   brown      light      blue              47 fema… femin…
10 Dormé       165  NA   brown      light      brown             NA fema… femin…
11 Padmé A…    165  45   brown      light      brown             46 fema… femin…
12 Shmi Sk…    163  NA   black      fair       brown             72 fema… femin…
13 Cordé       157  NA   brown      light      brown             NA fema… femin…
14 Leia Or…    150  49   brown      light      brown             19 fema… femin…
15 Mon Mot…    150  NA   auburn     fair       blue              48 fema… femin…
16 Rey          NA  NA   brown      light      hazel             NA fema… femin…
# ℹ 5 more variables: homeworld <chr>, species <chr>, films <list>,
#   vehicles <list>, starships <list>
Subsetting observations (row)
Adding multiple condition:
# A tibble: 24 × 14
   name     height  mass hair_color skin_color eye_color birth_year sex   gender
   <chr>     <int> <dbl> <chr>      <chr>      <chr>          <dbl> <chr> <chr>
 1 Luke Sk…    172    77 blond      fair       blue              19 male  mascu…
 2 C-3PO       167    75 <NA>       gold       yellow           112 none  mascu…
 3 Owen La…    178   120 brown, gr… light      blue              52 male  mascu…
 4 Beru Wh…    165    75 brown      light      blue              47 fema… femin…
 5 Greedo      173    74 <NA>       green      black             44 male  mascu…
 6 Jabba D…    175  1358 <NA>       green-tan… orange           600 herm… mascu…
 7 Wedge A…    170    77 brown      fair       hazel             21 male  mascu…
 8 Palpati…    170    75 grey       pale       yellow            82 male  mascu…
 9 Lando C…    177    79 black      dark       brown             31 male  mascu…
10 Lobot       175    79 none       light      blue              37 male  mascu…
# ℹ 14 more rows
# ℹ 5 more variables: homeworld <chr>, species <chr>, films <list>,
#   vehicles <list>, starships <list>
Further examples
Filter brown and black hair_color
# A tibble: 31 × 14
   name     height  mass hair_color skin_color eye_color birth_year sex   gender
   <chr>     <int> <dbl> <chr>      <chr>      <chr>          <dbl> <chr> <chr>
 1 Leia Or…    150  49   brown      light      brown           19   fema… femin…
 2 Beru Wh…    165  75   brown      light      blue            47   fema… femin…
 3 Biggs D…    183  84   black      light      brown           24   male  mascu…
 4 Chewbac…    228 112   brown      unknown    blue           200   male  mascu…
 5 Han Solo    180  80   brown      fair       brown           29   male  mascu…
 6 Wedge A…    170  77   brown      fair       hazel           21   male  mascu…
 7 Jek Ton…    180 110   brown      fair       blue            NA   male  mascu…
 8 Boba Fe…    183  78.2 black      fair       brown           31.5 male  mascu…
 9 Lando C…    177  79   black      dark       brown           31   male  mascu…
10 Arvel C…     NA  NA   brown      fair       brown           NA   male  mascu…
# ℹ 21 more rows
# ℹ 5 more variables: homeworld <chr>, species <chr>, films <list>,
#   vehicles <list>, starships <list>
Choose row by position
# A tibble: 6 × 14
  name      height  mass hair_color skin_color eye_color birth_year sex   gender
  <chr>      <int> <dbl> <chr>      <chr>      <chr>          <dbl> <chr> <chr>
1 Yarael P…    264    NA none       white      yellow            NA male  mascu…
2 Tarfful      234   136 brown      brown      blue              NA male  mascu…
3 Lama Su      229    88 none       grey       black             NA male  mascu…
4 Chewbacca    228   112 brown      unknown    blue             200 male  mascu…
5 Roos Tar…    224    82 none       grey       orange            NA male  mascu…
6 Grievous     216   159 none       brown, wh… green, y…         NA male  mascu…
# ℹ 5 more variables: homeworld <chr>, species <chr>, films <list>,
#   vehicles <list>, starships <list>
Subsetting variables (columns)
 [1] "name"         "genus"        "vore"         "order"        "conservation"
 [6] "sleep_total"  "sleep_rem"    "sleep_cycle"  "awake"        "brainwt"
[11] "bodywt"
# A tibble: 83 × 6
sleep_total sleep_rem sleep_cycle awake brainwt bodywt
<dbl> <dbl> <dbl> <dbl> <dbl> <dbl>
1 12.1 NA NA 11.9 NA 50
2 17 1.8 NA 7 0.0155 0.48
3 14.4 2.4 NA 9.6 NA 1.35
4 14.9 2.3 0.133 9.1 0.00029 0.019
5 4 0.7 0.667 20 0.423 600
6 14.4 2.2 0.767 9.6 NA 3.85
7 8.7 1.4 0.383 15.3 NA 20.5
8 7 NA NA 17 NA 0.045
9 10.1 2.9 0.333 13.9 0.07 14
10 3 NA NA 21 0.0982 14.8
# ℹ 73 more rowsSubsetting variables (columns) by their names
Additional tips
Real-world data are usually messier. The janitor package is useful to fix this kind of problem
# A tibble: 1 × 3
  ColNum1 COLNUM2 `COL & NUM3`
    <dbl>   <dbl>        <dbl>
1 1 2 3Creating new columns
Returning to our msleep dataset, after filtering and re-ordering, we can create a new column with mutate(). Within mutate(), we will calculate the number of minutes each mammal sleeps by multiplying the number of hours each animal sleeps by 60 mins
msleep %>%
  filter(order == "Primates", sleep_total > 10) %>%
  select(name, sleep_rem, sleep_cycle, sleep_total) %>%
  arrange(name) %>%
  mutate(sleep_total_min = sleep_total * 60)
# A tibble: 5 × 5
name sleep_rem sleep_cycle sleep_total sleep_total_min
<chr> <dbl> <dbl> <dbl> <dbl>
1 Macaque 1.2 0.75 10.1 606
2 Owl monkey 1.8 NA 17 1020
3 Patas monkey 1.1 NA 10.9 654
4 Potto NA NA 11 660
5 Slow loris NA NA 11 660Summarising exercise
tablea <- msleep %>%
  group_by(order) %>%
  summarise(
    n = n(),
    mean_sleep = mean(sleep_total),
    sd_sleep = sd(sleep_total)
  )
tablea
# A tibble: 19 × 4
order n mean_sleep sd_sleep
<chr> <int> <dbl> <dbl>
1 Afrosoricida 1 15.6 NA
2 Artiodactyla 6 4.52 2.51
3 Carnivora 12 10.1 3.50
4 Cetacea 3 4.5 1.57
5 Chiroptera 2 19.8 0.141
6 Cingulata 2 17.8 0.495
7 Didelphimorphia 2 18.7 0.990
8 Diprotodontia 2 12.4 1.84
9 Erinaceomorpha 2 10.2 0.141
10 Hyracoidea 3 5.67 0.551
11 Lagomorpha 1 8.4 NA
12 Monotremata 1 8.6 NA
13 Perissodactyla 3 3.47 0.814
14 Pilosa 1 14.4 NA
15 Primates 12 10.5 2.21
16 Proboscidea 2 3.6 0.424
17 Rodentia 22 12.5 2.81
18 Scandentia 1 8.9 NA
19 Soricomorpha 5 11.1 2.70 Producing tables
Producing tables
| order | n | mean_sleep | sd_sleep |
|---|---|---|---|
| Afrosoricida | 1 | 15.600000 | NA |
| Artiodactyla | 6 | 4.516667 | 2.5119050 |
| Carnivora | 12 | 10.116667 | 3.5021638 |
| Cetacea | 3 | 4.500000 | 1.5716234 |
| Chiroptera | 2 | 19.800000 | 0.1414214 |
| Cingulata | 2 | 17.750000 | 0.4949747 |
| Didelphimorphia | 2 | 18.700000 | 0.9899495 |
| Diprotodontia | 2 | 12.400000 | 1.8384776 |
| Erinaceomorpha | 2 | 10.200000 | 0.1414214 |
| Hyracoidea | 3 | 5.666667 | 0.5507571 |
| Lagomorpha | 1 | 8.400000 | NA |
| Monotremata | 1 | 8.600000 | NA |
| Perissodactyla | 3 | 3.466667 | 0.8144528 |
| Pilosa | 1 | 14.400000 | NA |
| Primates | 12 | 10.500000 | 2.2098951 |
| Proboscidea | 2 | 3.600000 | 0.4242641 |
| Rodentia | 22 | 12.468182 | 2.8132994 |
| Scandentia | 1 | 8.900000 | NA |
| Soricomorpha | 5 | 11.100000 | 2.7046257 |
Grouped summaries
# A tibble: 19 × 2
   order           mean_sleep
   <chr>                <dbl>
 1 Afrosoricida         15.6
 2 Artiodactyla          4.52
 3 Carnivora            10.1
 4 Cetacea               4.5
 5 Chiroptera           19.8
 6 Cingulata            17.8
 7 Didelphimorphia      18.7
 8 Diprotodontia        12.4
 9 Erinaceomorpha       10.2
10 Hyracoidea            5.67
11 Lagomorpha            8.4
12 Monotremata           8.6
13 Perissodactyla        3.47
14 Pilosa               14.4
15 Primates             10.5
16 Proboscidea           3.6
17 Rodentia             12.5
18 Scandentia            8.9
19 Soricomorpha         11.1
Combining Data Across Data Frames
There is often information stored in several separate data frames that you’ll want in a single data frame. There are many different ways to join separate data frames. Here, we’ll demonstrate how left_join() function works
#create data frame
df1 <- data.frame(a = c('a', 'b', 'c', 'd', 'e', 'f'),
                  b = c(12, 14, 14, 18, 22, 23))

df2 <- data.frame(a = c('a', 'a', 'a', 'b', 'b', 'b'),
                  c = c(23, 24, 33, 34, 37, 41))

df3 <- data.frame(a = c('d', 'e', 'f', 'g', 'h', 'i'),
                  d = c(23, 24, 33, 34, 37, 41))
combined_data <- df1 %>%
              left_join(df2, by='a') %>%
              left_join(df3, by='a')
combined_data
a b c d
1 a 12 23 NA
2 a 12 24 NA
3 a 12 33 NA
4 b 14 34 NA
5 b 14 37 NA
6 b 14 41 NA
7 c 14 NA NA
8 d 18 NA 23
9 e 22 NA 24
10 f 23 NA 33Lab exercise
Problem set:
Import the dataset called “Natural disasters (EMDAT)”: This data has been aggregated by Our World in Data by country and year based on the raw database of disasters published by EM-DAT, CRED / UCLouvain, Brussels, Belgium
Create a new public repository for the project (e.g. README.md, scripts)
Inspect the data briefly and identify its structure
Select the variables that capture the information related to deaths, injuries, homelessness caused by all disasters. You can rename the variables
Create three tables showing the highest averages of deaths, injuries, and homelessness (e.g. top 10)
Create a new binary variable in the original dataset to show whether the number of deaths by all disasters is higher than 500 in a given year
Reshape the dataset (selected version) and save it as a separate dataset in your repository
SOCS0100 – Computational Social Science