🗓️ Week 04
Automating – Functional Programming

25 Oct 2024

Conditional Flow

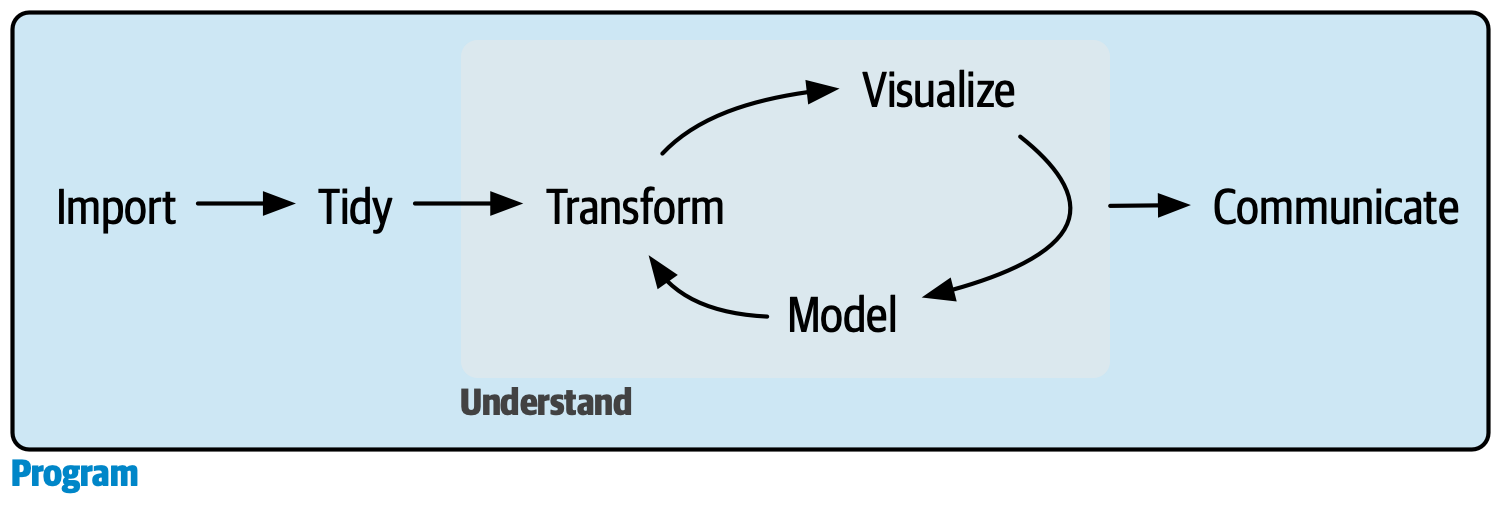
Programming in R

  • Repeating yourself in code is dangerous because it can easily lead to errors and inconsistencies

  • While the syntax might vary, the basic idea of flow, functions, and iteration are common across all programming languages (e.g. Python)

Source:R for Data Science

Setup

# Install packages
if (!require("pacman")) {
  install.packages("pacman")
}

pacman::p_load(
  tidyverse, # tidyverse pkgs including purrr
  glue, #combining strings and objects
  gapminder, # dataset
  ggplot2, #plotting
  gridExtra #arranging plots
  ) 

Flow control

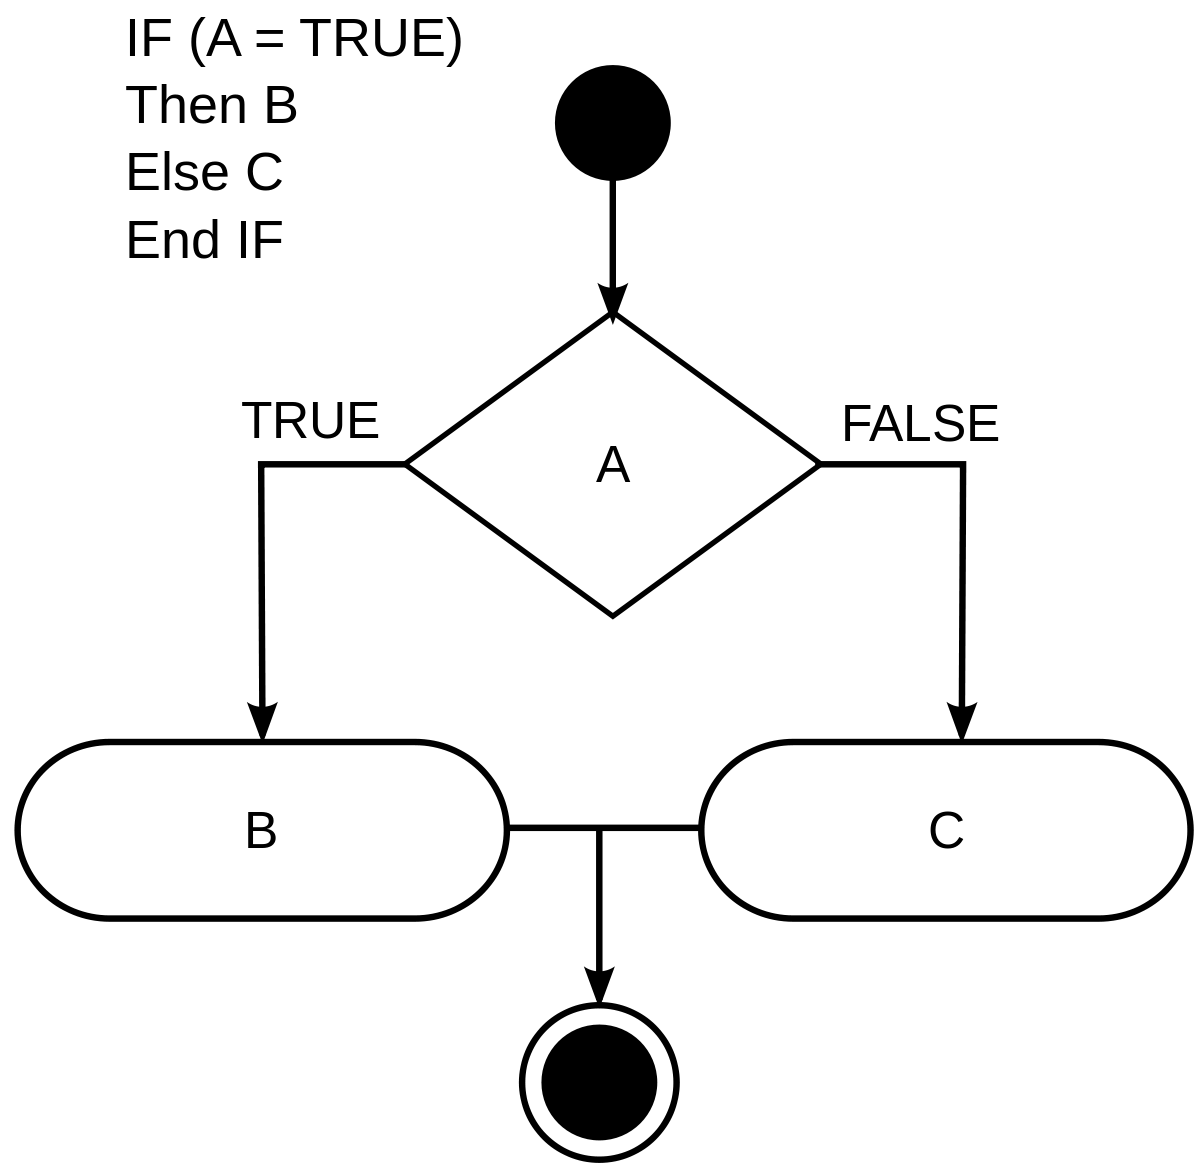
  • Sometimes you only want to execute code if a certain condition is met (if-else statement)
if (condition) {
  # Code executed when condition is TRUE
} else {
  # Code executed when condition is FALSE
}
  • Condition is a statement that must always evaluate to either TRUE or FALSE (i.e. a vector of length 1)

Source:R for Data Science

Flow control (examples)

average = 72
if (average > 69) {
    print("First-class honours")
} else {
    print("Second-class honours")
}
[1] "First-class honours"
average = 69
if (average > 69) {
    print("First-class honours")
} else {
    print("Second-class honours")
}
[1] "Second-class honours"

What would you do with multiple conditions?

if (this) {
  # Do that
} else if (that) {
  # Do something else
} else {
  # Do something completely different
}

Going back to earlier one-condition example

  • You can generate more complex conditional statements with Boolean operators like & and |:
average = 50 

if (average > 69) {
    print("Firs-class honours")
} else if (average < 70 & average > 59) {
    print("Second-class honours")
} else {
    print("Third-class honours")
}
[1] "Third-class honours"
  • It’s not a good idea to write nested code (lots of else_if() or ifelse())

  • It is not easy to read or debug

Coding style MATTERS!

  • Both the “if” and “function” statements should almost always be accompanied by curly braces {}, and the code within them should be indented. Start opening curly braces on a new line, close them on their own line, except when followed by “else,” and maintain code indentation inside them
# Bad example
if (y < 0 && debug)
message("Y is negative")

if (y == 0) {
  log(x)
} 
else {
  y ^ x
}

# Good example
if (y < 0 && debug) {
  message("Y is negative")
}

if (y == 0) {
  log(x)
} else {
  y ^ x
}

if vs if_else

  • Vector operations are where you make multiple comparisons simultaneously for each value stored inside a vector

  • Imagine you wanted to create a new column identifying whether or not a country-year observation has a life expectancy of at least 35

gap <- gapminder
head(gap)
# A tibble: 6 Ă— 6
  country     continent  year lifeExp      pop gdpPercap
  <fct>       <fct>     <int>   <dbl>    <int>     <dbl>
1 Afghanistan Asia       1952    28.8  8425333      779.
2 Afghanistan Asia       1957    30.3  9240934      821.
3 Afghanistan Asia       1962    32.0 10267083      853.
4 Afghanistan Asia       1967    34.0 11537966      836.
5 Afghanistan Asia       1972    36.1 13079460      740.
6 Afghanistan Asia       1977    38.4 14880372      786.
gap_if <- gap %>%
   mutate(life.35 = if(lifeExp >= 35){
     1
   } else {
     0
   })
head(gap_if)
  • Try this code and tell us what you think it’s wrong

Use if_else() instead

  • This vectorises the if-else comparison and makes a separate comparison for each row of the data frame
gap_ifelse <- gap %>%
  mutate(life.35 = if_else(lifeExp >= 35, 1, 0))

gap_ifelse
# A tibble: 1,704 Ă— 7
   country     continent  year lifeExp      pop gdpPercap life.35
   <fct>       <fct>     <int>   <dbl>    <int>     <dbl>   <dbl>
 1 Afghanistan Asia       1952    28.8  8425333      779.       0
 2 Afghanistan Asia       1957    30.3  9240934      821.       0
 3 Afghanistan Asia       1962    32.0 10267083      853.       0
 4 Afghanistan Asia       1967    34.0 11537966      836.       0
 5 Afghanistan Asia       1972    36.1 13079460      740.       1
 6 Afghanistan Asia       1977    38.4 14880372      786.       1
 7 Afghanistan Asia       1982    39.9 12881816      978.       1
 8 Afghanistan Asia       1987    40.8 13867957      852.       1
 9 Afghanistan Asia       1992    41.7 16317921      649.       1
10 Afghanistan Asia       1997    41.8 22227415      635.       1
# â„ą 1,694 more rows

Functions

Functions

  • Functions are the basic building blocks of programmes

  • Think of them as mini-scripts. R provides many built-in functions and allows programmers to define their own functions. We have already used dozens of functions created by others (e.g. filter() and sd())

  • You will learn how to write you own functions. The details are pretty simple, yet as usual it is good to get lots of practice!

Source:https://www.learnbyexample.org/

Why we need functions

  • Functions allow you to automate common tasks in a more powerful and general way than copy-and-pasting
gap <- gapminder

gap_norm <- gap %>%
  mutate(pop_norm = (pop - min(pop)) / (max(pop) - min (pop)),
         gdp_norm = (gdpPercap - min(gdpPercap)) / (max(gdpPercap) - min (gdpPercap)),
         life_norm = (lifeExp - min(lifeExp) / (max(pop)) - min (lifeExp)))

summary(gap_norm$pop_norm)
  • Take a look at the code above and spot the mistake?

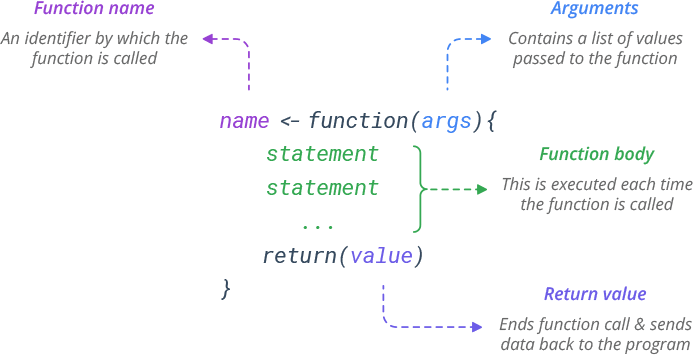
Key components of functions

  • Name: This should be informative and describe what the function does

  • Arguments: or list of inputs, to the function. They go inside the parentheses in function()

  • The body: This is the block of code within {} that immediately follows function(…), and it is the code that you develop to perform the action described in the name using the arguments you provide

my_function <- function(x, y){
  # do
  # something
  # here
  return(result)
}

Writing a function

simple.function <- function(x, y){
  print(x - y + 1)
}

simple.function(x = 2, y = 10)
[1] -7
  • Note that return() will only process a single object, so multiple items must usually be returned as a list
multiple.items <- function(x,y){
  thing1 <- x
  thing2 <- y
  return(list(thing1, thing2))
}

multiple.items(x = "some text", y = "some data")
[[1]]
[1] "some text"

[[2]]
[1] "some data"

Functional programming

Functional programming

  • We will now learn how to use purrr to automate workflow in a cleaner, faster, and more extendable way

Task: replacing -99 with NA

  • Let’s imagine df is a survey dataset.

  • a, b, c, d = Survey questions

  • -99: missing responses

# Data

set.seed(1234) # for reproducibility

df <- tibble(
  "a" = sample(c(-99, 1:3), size = 5, replace = TRUE),
  "b" = sample(c(-99, 1:3), size = 5, replace = TRUE),
  "c" = sample(c(-99, 1:3), size = 5, replace = TRUE),
  "d" = sample(c(-99, 1:3), size = 5, replace = TRUE)
)

How would you replace -99 with NA by copy-and-pasting?

# Copy and paste
df$a[df$a == -99] <- NA
df$b[df$b == -99] <- NA
df$c[df$c == -99] <- NA
df$d[df$d == -99] <- NA

df
# A tibble: 5 Ă— 4
      a     b     c     d
  <dbl> <dbl> <dbl> <dbl>
1     3     3     3     1
2     3     2     3     1
3     1    NA     1     2
4     1    NA     2     1
5    NA     1     1     3

Let’s use a function for this operation

  • If you write a function, you gain efficiency because you don’t need to copy and paste the computation part
fix_missing <- function(x) {
  x[x == -99] <- NA
  x
}

# Apply function to each column (vector)

df$a <- fix_missing(df$a)
df$b <- fix_missing(df$b)
df$c <- fix_missing(df$c)
df$d <- fix_missing(df$d)

df
# A tibble: 5 Ă— 4
      a     b     c     d
  <dbl> <dbl> <dbl> <dbl>
1     3     3     3     1
2     3     2     3     1
3     1    NA     1     2
4     1    NA     2     1
5    NA     1     1     3

How about a tidy solution? (purrr)

  • map() is a good alternative to for loop
df <- purrr::map_df(df, fix_missing)

df
# A tibble: 5 Ă— 4
      a     b     c     d
  <dbl> <dbl> <dbl> <dbl>
1     3     3     3     1
2     3     2     3     1
3     1    NA     1     2
4     1    NA     2     1
5    NA     1     1     3

map() is a higher-order function

  • This is how map() works

  • It applies a given function to each element of a list/vector.

Source:Computational Thinking for Social Scientists

Illustrating why map() can be more efficient than loops

data("airquality")

# Placeholder
out1 <- vector("double", ncol(airquality))

# Sequence variable
for (i in seq_along(airquality)) { 

  # Assign an iteration result to each element of the placeholder list 
  out1[[i]] <- mean(airquality[[i]], na.rm = TRUE)
}

#vs one-liner map()
out1 <- airquality %>% map_dbl(mean, na.rm = TRUE)
out1
     Ozone    Solar.R       Wind       Temp      Month        Day 
 42.129310 185.931507   9.957516  77.882353   6.993464  15.803922 

Main takeaways

  • map() is more readable, faster, and easily extendable with other data science tasks (e.g. wrangling and visualisation) using %>%

  • purrr::map() is simpler to write

  • There is one function for each type of output:

    • map() makes a list
    • map_lgl() makes a logical vector
    • map_int() makes an integer vector
    • map_dbl() makes a double vector
    • map_chr() makes a character vector

Some data wrangling exercises using purrr

  • Filtering:
# Create a list of data frames with England's biggest cities and their populations
data_list <- list(
  data.frame(City = c("London", "Birmingham", "Manchester"),
             Population = c(8961989, 1141816, 547627)),
  data.frame(City = c("Leeds", "Liverpool", "Newcastle"),
             Population = c(793139, 494814, 148190))
)

# Define the condition for filtering data frames
population_threshold <- 500000

filtered_data <- map(data_list, ~ filter(.x, Population >= population_threshold))

filtered_data
[[1]]
        City Population
1     London    8961989
2 Birmingham    1141816
3 Manchester     547627

[[2]]
   City Population
1 Leeds     793139

Some data wrangling exercises using purrr II

  • Combining data frames:
# Combine the filtered data frames into a single data frame
combined_data <- reduce(filtered_data, bind_rows)
combined_data
        City Population
1     London    8961989
2 Birmingham    1141816
3 Manchester     547627
4      Leeds     793139

Automate plotting

  • We will how to use map() and glue() to automate creating multiple plots

  • Task: making the following data visualisation process more efficient

data("airquality")

airquality %>%
  ggplot(aes(x = Ozone, y = Solar.R)) +
  geom_point() +
  labs(
    title = "Relationship between Ozone and Solar.R",
    y = "Solar.R"
  )
airquality %>%
  ggplot(aes(x = Ozone, y = Wind)) +
  geom_point() +
  labs(
    title = "Relationship between Ozone and Wind",
    y = "Wind"
  )
airquality %>%
  ggplot(aes(x = Ozone, y = Temp)) +
  geom_point() +
  labs(
    title = "Relationship between Ozone and Temp",
    y = "Temp"
  )

Solution to the automation problem

  • glue() combines strings and objects

For instance:

names <- c("Nikki", "Maria", "Ozan")

fields <- c("Economics", "Demography", "Sociology")

glue("{names} is interested in {fields}.")
Nikki is interested in Economics.
Maria is interested in Demography.
Ozan is interested in Sociology.
  • Hence, we can now combine glue() and map()

Automatic plotting function

create_point_plot <- function(i) {
  airquality %>%
    ggplot(aes_string(x = names(airquality)[1], y = names(airquality)[i])) +
    geom_point() +
    labs(
      title = glue("Relationship between Ozone and {names(airquality)[i]}"),
      y = glue("{names(airquality)[i]}")
    )
}
  • The final step is to put the function in map()
plots_list <- map(2:ncol(airquality), create_point_plot)
plots_grid <- gridExtra::grid.arrange(grobs = plots_list, ncol = 2) # Adjust ncol as needed

Automatic plotting function

plots_grid
TableGrob (3 x 2) "arrange": 5 grobs
  z     cells    name           grob
1 1 (1-1,1-1) arrange gtable[layout]
2 2 (1-1,2-2) arrange gtable[layout]
3 3 (2-2,1-1) arrange gtable[layout]
4 4 (2-2,2-2) arrange gtable[layout]
5 5 (3-3,1-1) arrange gtable[layout]

Lab exercise

  • Again import the dataset called “Natural disasters (EMDAT)”

  • Create a new public repository on GitHub for this week’s project and add your collaborators

  • Open a new R script and work on the following automating tasks

  • Using purrr, please automate at least one data wrangling task based on the dataset (e.g. summarising data)

  • Using purrr please automate plotting the trends of deaths, injuries, and homelessness caused by all disasters for 5 countries in the dataset